
A basic uptime check answers one question: did the server return a response? That's necessary and nowhere near sufficient. Plenty of outages are up the whole time — the TLS cert expired so browsers refuse the site, login is broken behind a 200-OK homepage, the data is hours stale, or the page loads but takes nine seconds. Self-hosted operators keep asking for "monitoring beyond uptime" because the green checkmark keeps lying to them. Here's what that actually means.
The failures a ping misses
- Expired certificate. The server responds fine over HTTP; browsers and mobile apps reject it over HTTPS. Your uptime check (often ignoring cert validity) stays green while users see a scary warning.
- Broken authentication. The homepage returns 200; login throws a 500. "Up" by the check, useless to users.
- Stale data. The app responds instantly with content from a sync that died yesterday. Nothing is "down," everything is wrong.
- Slow but up. A 200 after 9 seconds is a failure to a human and a success to a naive check.
Layer the checks
Add checks that match how the service actually fails:
- Certificate expiry — alert days before a cert expires, not when it already broke. The cheapest high-value check there is.
- Content/keyword checks — assert the response contains the expected text (a logged-in marker, a "last updated" timestamp), not just that it returned. This catches broken auth and stale data.
- Latency thresholds — alert when response time crosses a budget, so "slow but up" becomes visible.
- Functional/synthetic checks — for critical flows, script the real action (log in, load a record) rather than hitting the homepage.
Keep it low-noise or you'll mute it
More checks means more chances to cry wolf. The discipline that keeps richer monitoring usable:
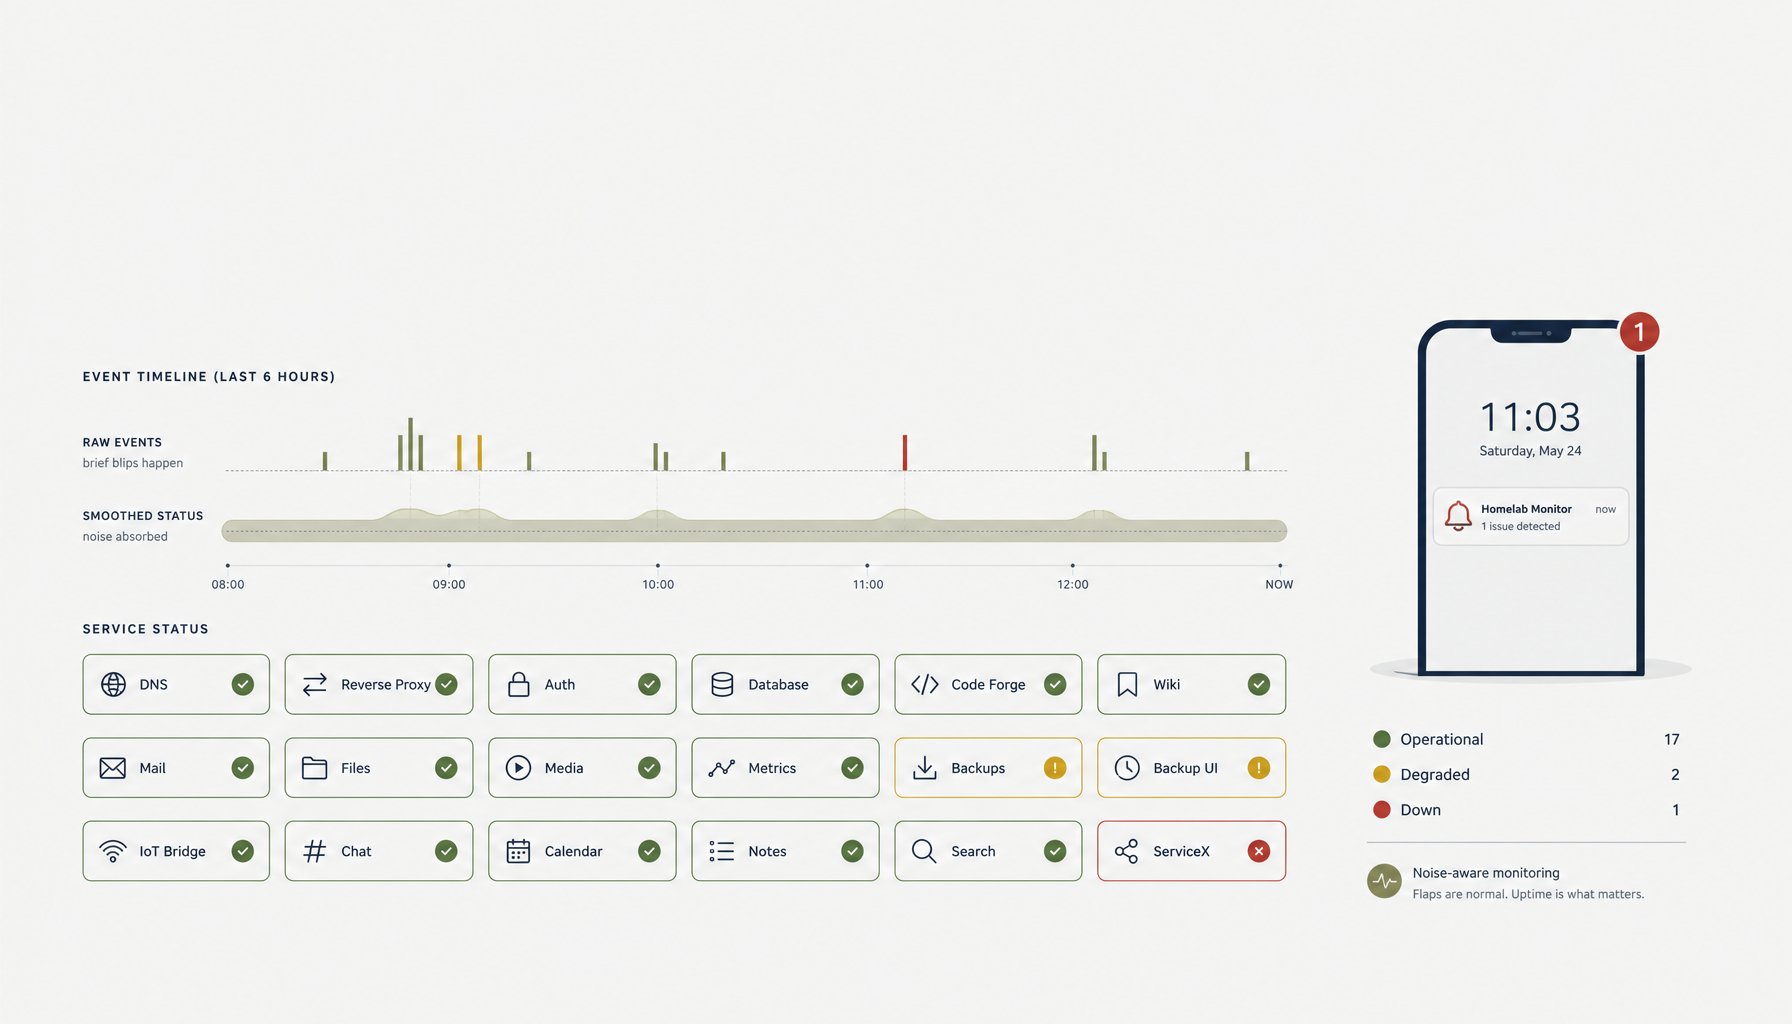
- Alert on sustained failure, not a single blip (require N consecutive fails).
- Route by severity — a cert expiring in 7 days is a warning; the site down now is a page.
- Carry context to the fix. The low-noise uptime-check approach and the alerting last-mile fixes apply directly.
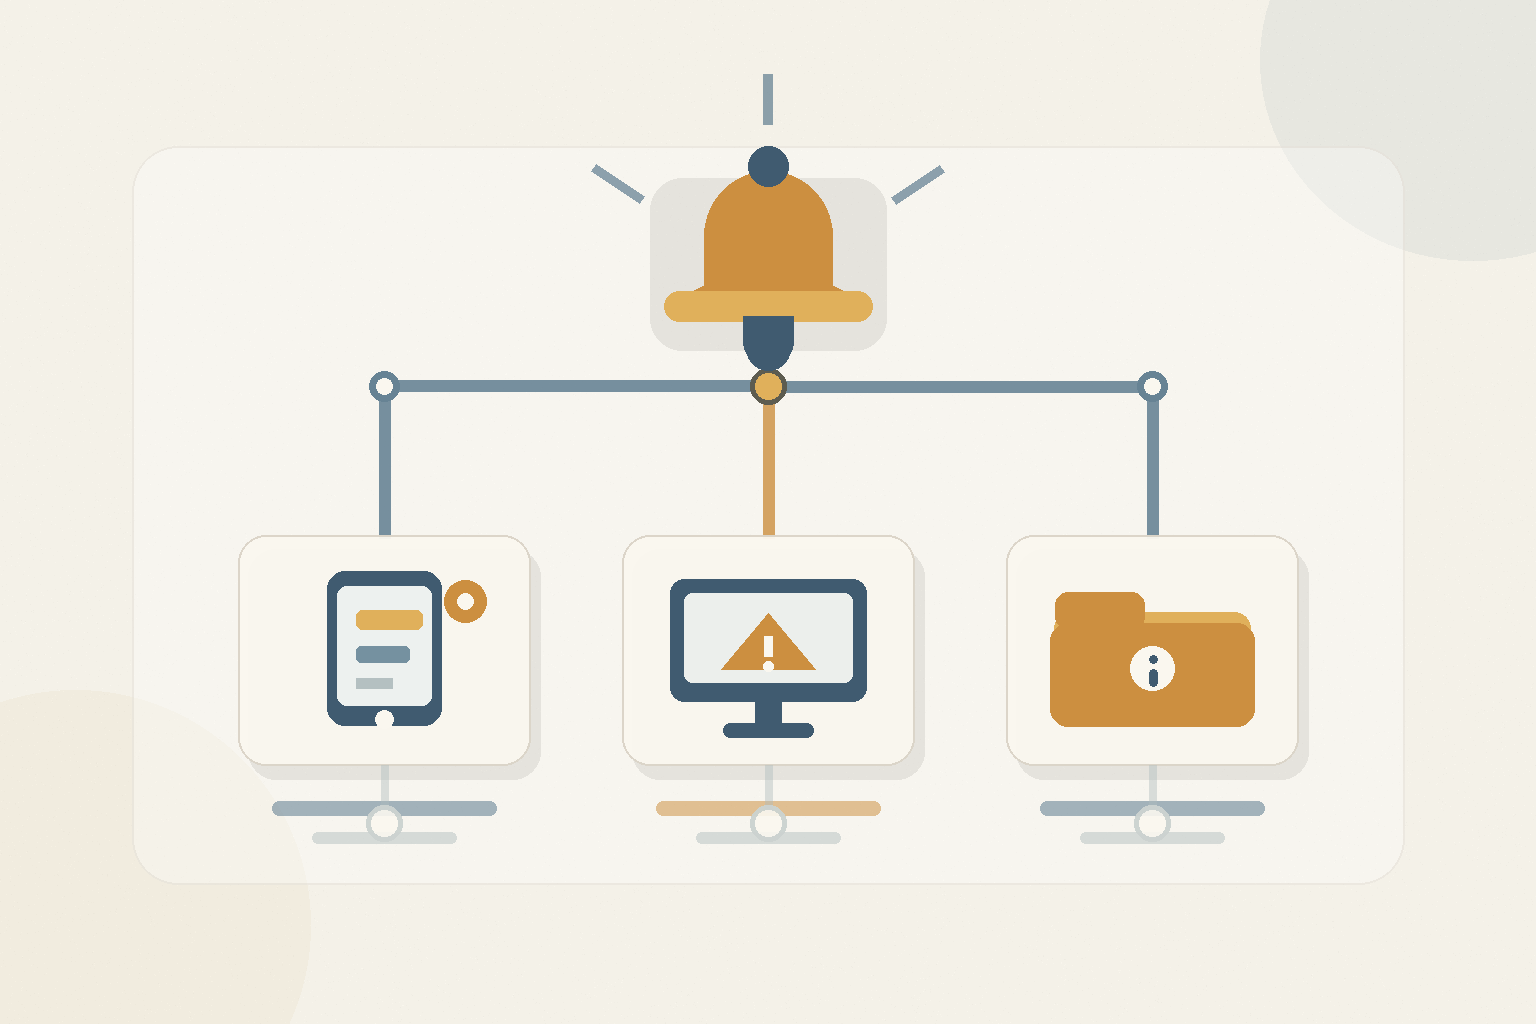 Severity-routed monitoring in ServerCompass — a cert-expiry warning and a hard-down page land in different places, so deeper checks don't drown you in noise.
Don't forget the cert-renewal loop itself
The most common "expired cert" cause isn't forgetting to monitor — it's a renewal that runs but doesn't reload the proxy, the exact trap in Let's Encrypt renew-and-reload behind a Docker proxy. Monitor the expiry and fix the renewal.
Checklist
- Certificate-expiry check that warns days ahead.
- Content/keyword assertions, not just a 200.
- Latency budget alerting for "slow but up."
- Synthetic checks for critical flows (login, key page).
- Sustained-failure + severity routing to stay low-noise.
Takeaway
"Is it up?" is the wrong question, because the answer is often yes while the service is broken. Check the cert before it expires, assert the page says what it should, watch latency, and script the flows that matter — then route it all low-noise so the richer signal stays trustworthy. Real monitoring tells you the service works, not merely that it answered.
From across the StoicSoft network
Hand-curated reads on the same topic from sister sites in the StoicSoft family.
 Deploy Handbook8 min read
Low-noise uptime checks: alert thresholds that survive a homelab full of services
Run twenty self-hosted services on a homelab and the default uptime-check thresholds will page you ten times a week for nothing. Most of the noise is design, not bad luck — single-probe checks, no flap suppression, severity treated as binary. Here's the configuration that quiets the alerts without losing real outages.
Read on deployhandbook.com Deploy Handbook7 min read
Hosted vs Self-Hosted Nextcloud for Small Teams: The Hidden Ops Costs Decide It
Managed Nextcloud's monthly fee looks expensive next to a $10 VPS — until you price the ops the host quietly does for you. A real hosted-vs-self-hosted comparison for small teams.
Read on deployhandbook.com Deploy Handbook8 min read
Best single-dashboard app health for self-hosters who aren't ready for Prometheus
Homelab and VPS users want one calm dashboard for app health — not a full observability stack. Here are the tools that hit the middle layer between SSH and Grafana.
Read on deployhandbook.com