
A self-hosted service usually looks healthy right up until the moment a real person depends on it. The web UI loads once, the container says it is running, the dashboard has a green row, and everyone moves on. The problem is that most failures in small infrastructure do not start at the happy-path install command. They start at the boundary between data, network, power, storage, credentials, clients, and the next change you make under pressure.
Fresh self-hosting posts point to a more specific monitoring need than simple green/red uptime. One homelab user running rootless Podman quadlet services wants per-container outbound blocking, domain allowlists, and traffic visibility but cannot see how to attach ntopng to rootless networking. Another dashboard showcase combines Beszel, Dockhand, and Borgmatic status so the operator can see server health, container management, and backup timing in one place. Earlier same-day n8n and monitoring threads reinforce the same pattern: small operators want service-level proof that containers are healthy, constrained, backed up, and not silently drifting. ServerCompass can turn this into a practical guide on container observability without building a full platform team That is the useful angle here: this is not another checklist for chasing a perfect homelab. It is a way to decide what must be true before you trust the service with real users, family data, client work, or a weekend migration.
The pattern behind the failure
pok1yoyo asks how to monitor rootless quadlet traffic and enforce per-container outbound allowlists when rootless Podman networking hides the normal interfaces. xhaythemx shows a Glance dashboard with OpenCloud, Immich, Beszel, Dockhand, and Borgmatic backup-state widgets. West-Inspection7096 from the same scan asks for a monitoring project that spans server, network, logs, security, and local AI analysis. The repeated signal is that self-hosters want container-level evidence and policy, not just an uptime page. Read that as a systems problem rather than a collection of unrelated tool complaints. One person may be looking at a NAS, another at a proxy, another at a media library, and another at a small VPS, but the shape is the same. A visible setup step succeeded while an invisible dependency stayed unproven.
That invisible dependency is where most self-hosted work becomes expensive. If you discover it during planning, it is a note in a runbook. If you discover it after a power cut, upgrade, certificate reload, or family movie night, it becomes an outage with incomplete evidence.
The source signal came from several current operator threads: thread 1, thread 2, thread 3.
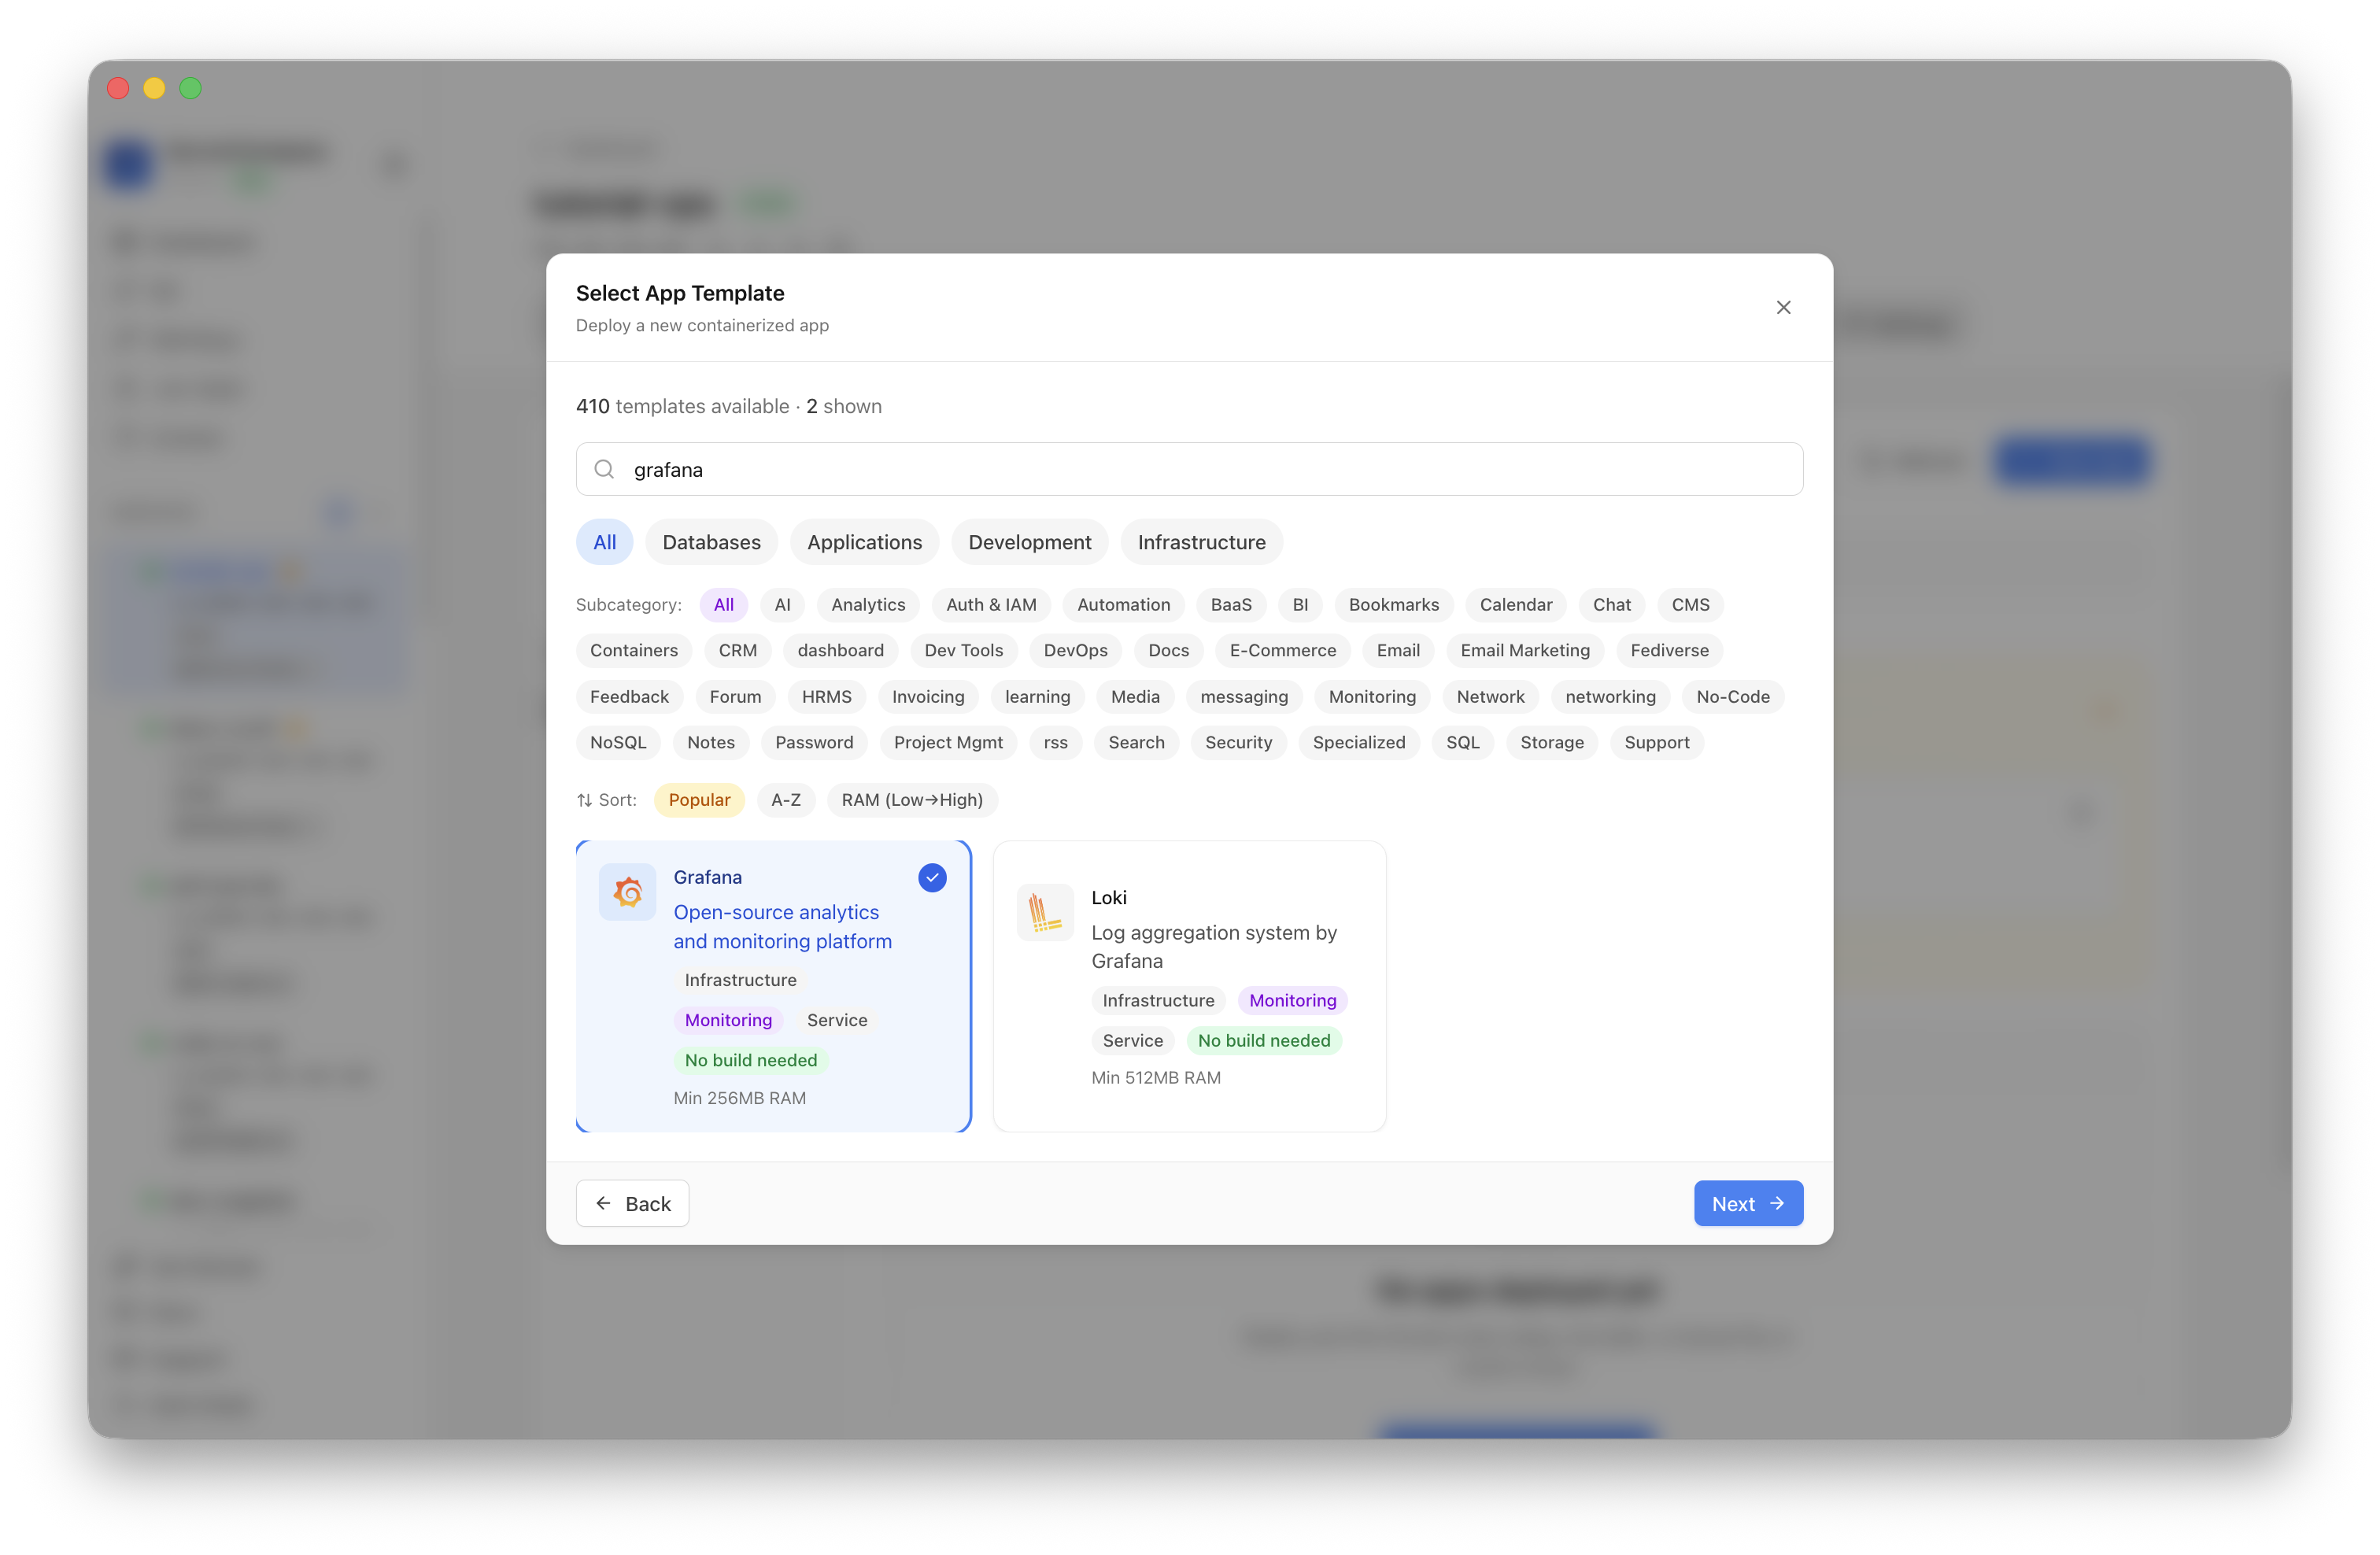
Use screenshots like this as a reminder to plan the deployment path, not only the app name.
Start with the promise the service is making
Before choosing the next app, OS, dashboard, tunnel, or VPS size, write one plain sentence: what does this service promise to keep working? A media server promises that people can find and play the library from the devices they actually use. A monitoring stack promises that an alert explains what changed, not just that a URL stopped answering. A migration promises that old data can be restored and the cutover can be reversed. A public web app promises that DNS, TLS, CORS, uploads, and background jobs all agree about the same production address.
That sentence gives you the operating boundary. It tells you which checks matter and which impressive-looking tooling can wait. It also keeps the plan grounded when a thread, tutorial, or AI assistant starts suggesting a pile of extra components.
For this topic, the relevant signals are monitoring, podman, docker, backups, homelab. Treat those tags as dependencies to prove. They are not just SEO labels; they are the parts of the system most likely to make the difference between a service that starts and a service that can be trusted.
The preflight map
Use this sequence before the install, migration, upgrade, or hardware purchase becomes irreversible:
- Boot path: Know whether the server can boot without the data pool, without the USB stick, and after a failed upgrade.
- Storage semantics: Record which numbers are quota, reservation, snapshot, parity, used blocks, and logical file size; they do not mean the same thing.
- Configuration backup: Export the hypervisor, NAS, container, and app configs separately from bulk data so recovery is not all-or-nothing.
- Restore sample: Restore one VM, one container volume, and one user-facing file before changing disks or filesystems.
- Rollback stop point: Define the exact symptom that means stop, roll back, and preserve evidence instead of trying one more fix.
The point is not to turn every home server into enterprise process. The point is to make the next hour of work reversible. A short written preflight catches the assumption that would otherwise stay hidden until the service is live.
What this looks like in practice
| Area | Proof you want before trusting it |
|---|---|
| Boot path | Know whether the server can boot without the data pool, without the USB stick, and after a failed upgrade. |
| Storage semantics | Record which numbers are quota, reservation, snapshot, parity, used blocks, and logical file size; they do not mean the same thing. |
| Configuration backup | Export the hypervisor, NAS, container, and app configs separately from bulk data so recovery is not all-or-nothing. |
| Restore sample | Restore one VM, one container volume, and one user-facing file before changing disks or filesystems. |
If one row in that table feels vague, that is the row to slow down on. Vague proof is usually a sign that the system is crossing a boundary: LAN to public internet, host filesystem to container mount, web UI to background worker, old disk to new pool, local client to remote client, or human memory to written runbook.
A useful preflight does not need to be long. It needs to be specific enough that a second person, or your future self, can repeat it without guessing what you meant. For example, "check backups" is weak. "Restore one app database dump and one uploaded file into a temporary path, then open the app against it" is useful. "Domain works" is weak. "Curl the public route from outside the LAN, verify the certificate, and test the real callback path" is useful.
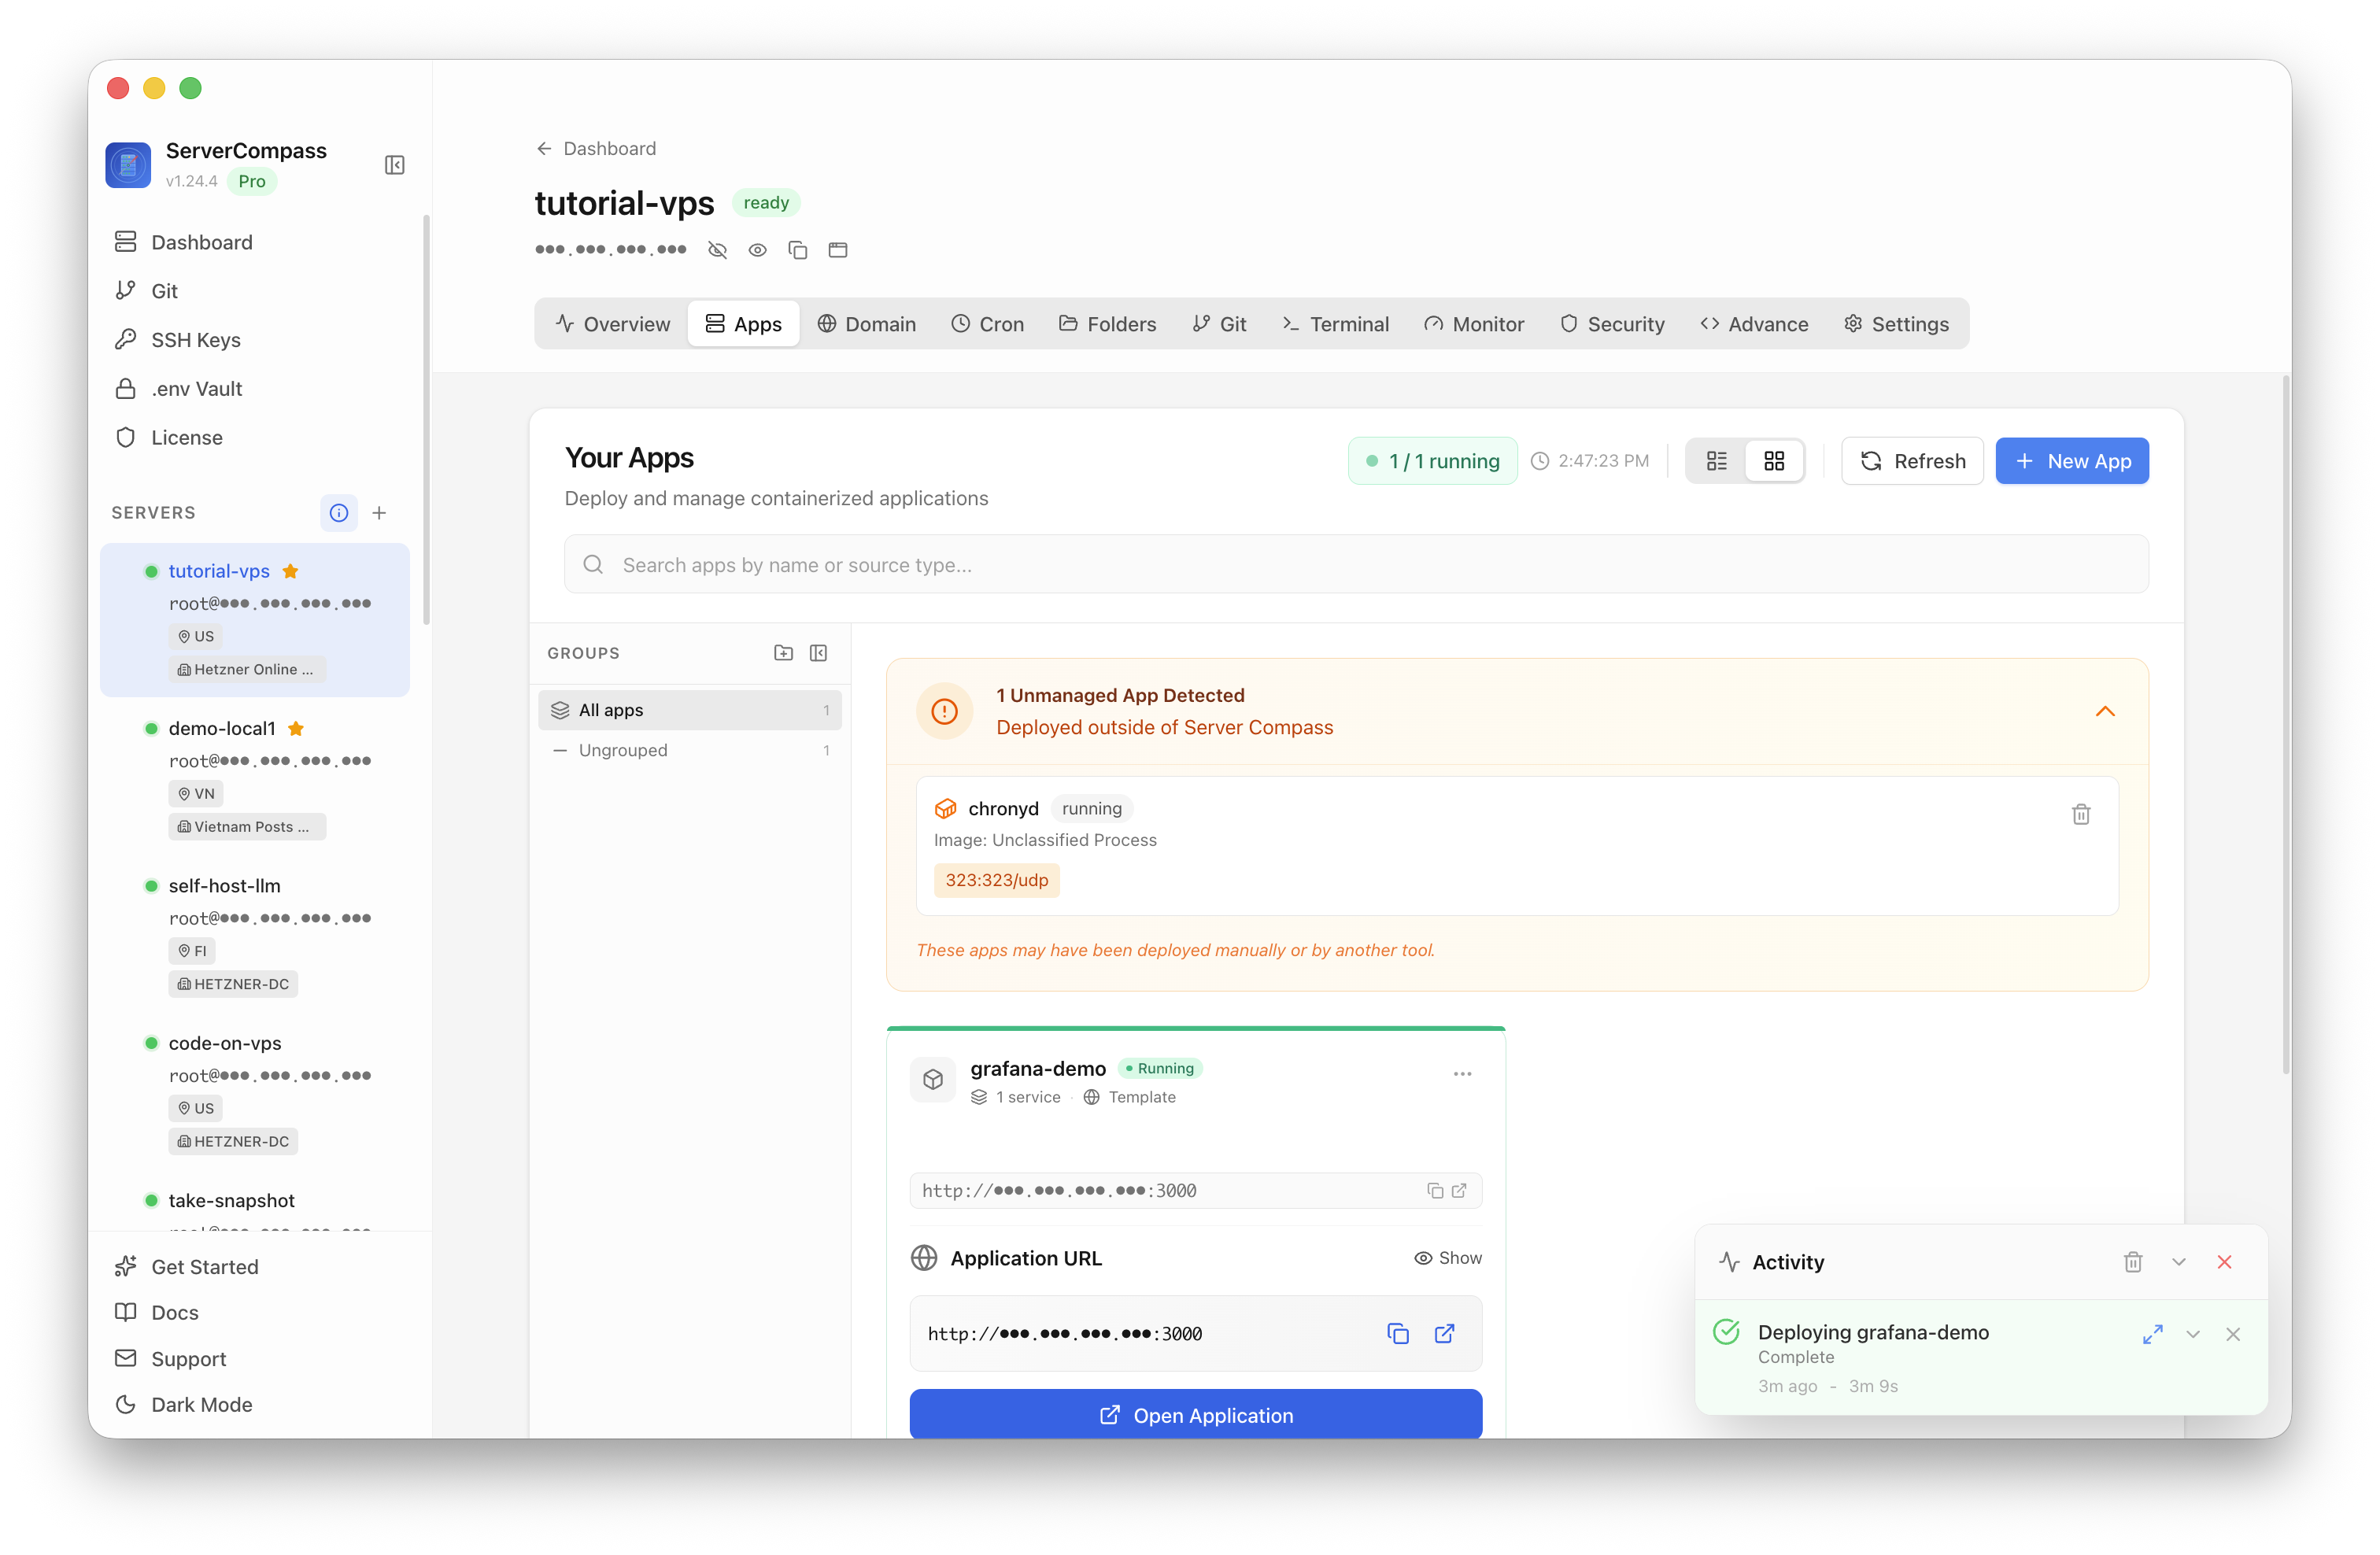
The deployment is only the first state to prove; the dashboard should lead into checks for data, access, rollback, and monitoring.
Keep the runbook small enough to use
The best runbook for a small self-hosted service is usually one page. It should include the service purpose, the data locations, the update command, the backup location, the restore sample, the public URL or private access method, the expected health check, and the rollback stop point. Anything longer tends to become documentation theatre. Anything shorter tends to skip the part you will need during the incident.
When the setup uses Docker Compose, keep the compose file, environment variables, and volume map together. When it uses a NAS or hypervisor, keep the storage ownership decision explicit. When it uses a reverse proxy, record which host terminates TLS and which app receives the upstream request. When it uses a tunnel or VPN, record whether the service is meant to be public, private, or split by route.
This is also where product selection becomes less emotional. You can compare tools by whether they make the proof easier. A tool that gives you logs, restart history, a clear volume map, and a rollback path may be better for a small operator than a more flexible platform that hides those basics behind extra layers.
Where ServerCompass fits
ServerCompass is useful when the work is no longer just "install the app" and has become "keep the app deployable on a VPS." It gives you a repeatable place to choose templates, see what was deployed, and keep the operational surface visible enough to inspect. That does not replace backups, DNS checks, client testing, or a recovery plan. It gives those checks a clearer starting point.
The practical move is to use a deployment tool for the repeatable part and keep the promise-specific proof in your own runbook. If this service matters, do not stop at a successful install screen. Prove the data path, prove the access path, prove the rollback path, and only then call it ready.
Final checklist
- Write the service promise in one sentence.
- List the data, network, storage, and credential boundaries.
- Run one outside-in access test and one inside-the-host health test.
- Restore a small sample before the next major change.
- Define the rollback trigger before you begin.
- Keep screenshots, commands, and links close to the deployment record.
That is enough structure for a small operator to move faster without turning every app into a platform project. More importantly, it turns vague confidence into evidence you can reuse the next time the same class of problem appears.
From across the StoicSoft network
Hand-curated reads on the same topic from sister sites in the StoicSoft family.
 Deploy Handbook7 min read
Lighter Than Kubernetes: Compose vs Podman vs K8s for a Single-Node Homelab
You want more structure than loose docker run commands but suspect Kubernetes is overkill for one Proxmox box. A practical comparison of Compose, rootless Podman, Podman Kube, and lightweight K8s.
Read on deployhandbook.com Deploy Handbook
Self-hosters need a middle path between one Compose VM and full platform engineering
Most self-hosters eventually hit a wall: a single Docker Compose VM starts to creak, but building a full internal platform with Nomad, Consul, Vault, and custom automation is a project in itself. There is a practical middle path worth knowing.
Read on deployhandbook.com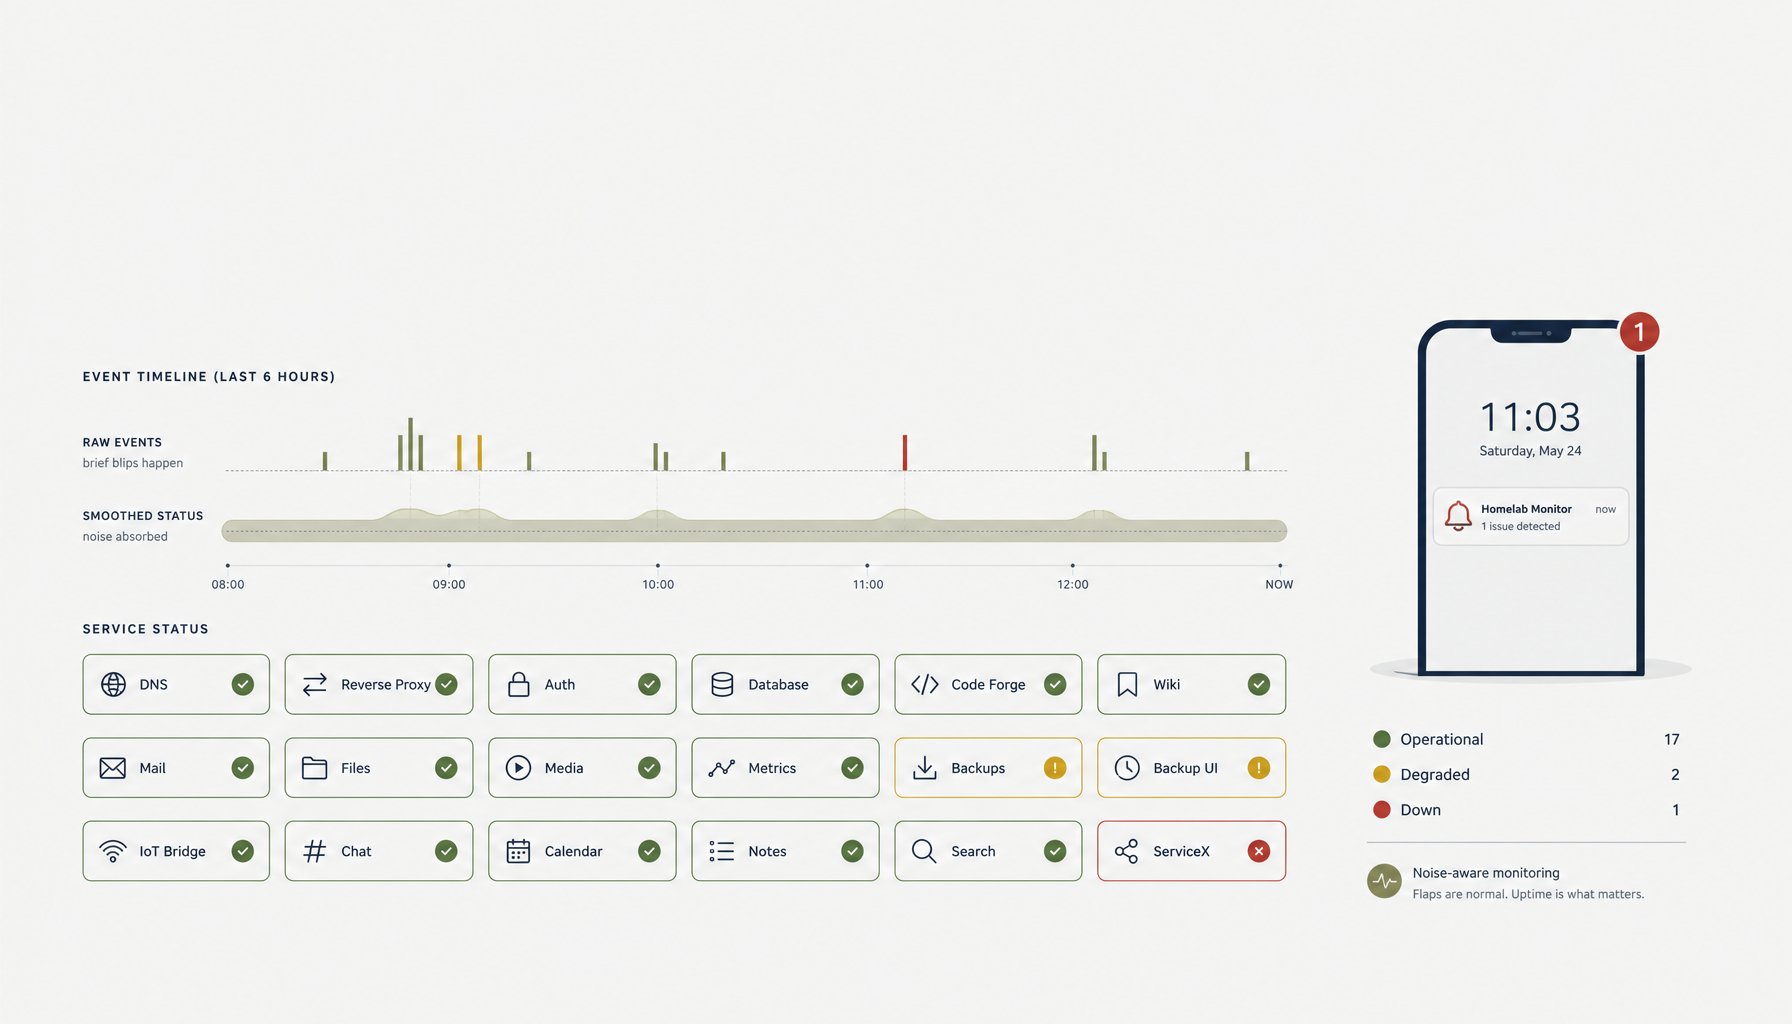 Deploy Handbook8 min read
Low-noise uptime checks: alert thresholds that survive a homelab full of services
Run twenty self-hosted services on a homelab and the default uptime-check thresholds will page you ten times a week for nothing. Most of the noise is design, not bad luck — single-probe checks, no flap suppression, severity treated as binary. Here's the configuration that quiets the alerts without losing real outages.
Read on deployhandbook.com Deploy Handbook8 min read
Best single-dashboard app health for self-hosters who aren't ready for Prometheus
Homelab and VPS users want one calm dashboard for app health — not a full observability stack. Here are the tools that hit the middle layer between SSH and Grafana.
Read on deployhandbook.com